



You can tell if Shopify SEO is working by watching four signals in the order they actually move:
- non-brand impressions in Search Console,
- queries climbing toward page 1,
- indexed page count against your sitemap total,
- click-through rate on category pages
Traffic is the wrong signal to check first because it moves months after the work does and mixes real SEO wins with paid, social, and brand growth that have nothing to do with organic search. Most merchants who conclude their SEO isn’t working reach that conclusion by looking at traffic too early.
Key takeaways
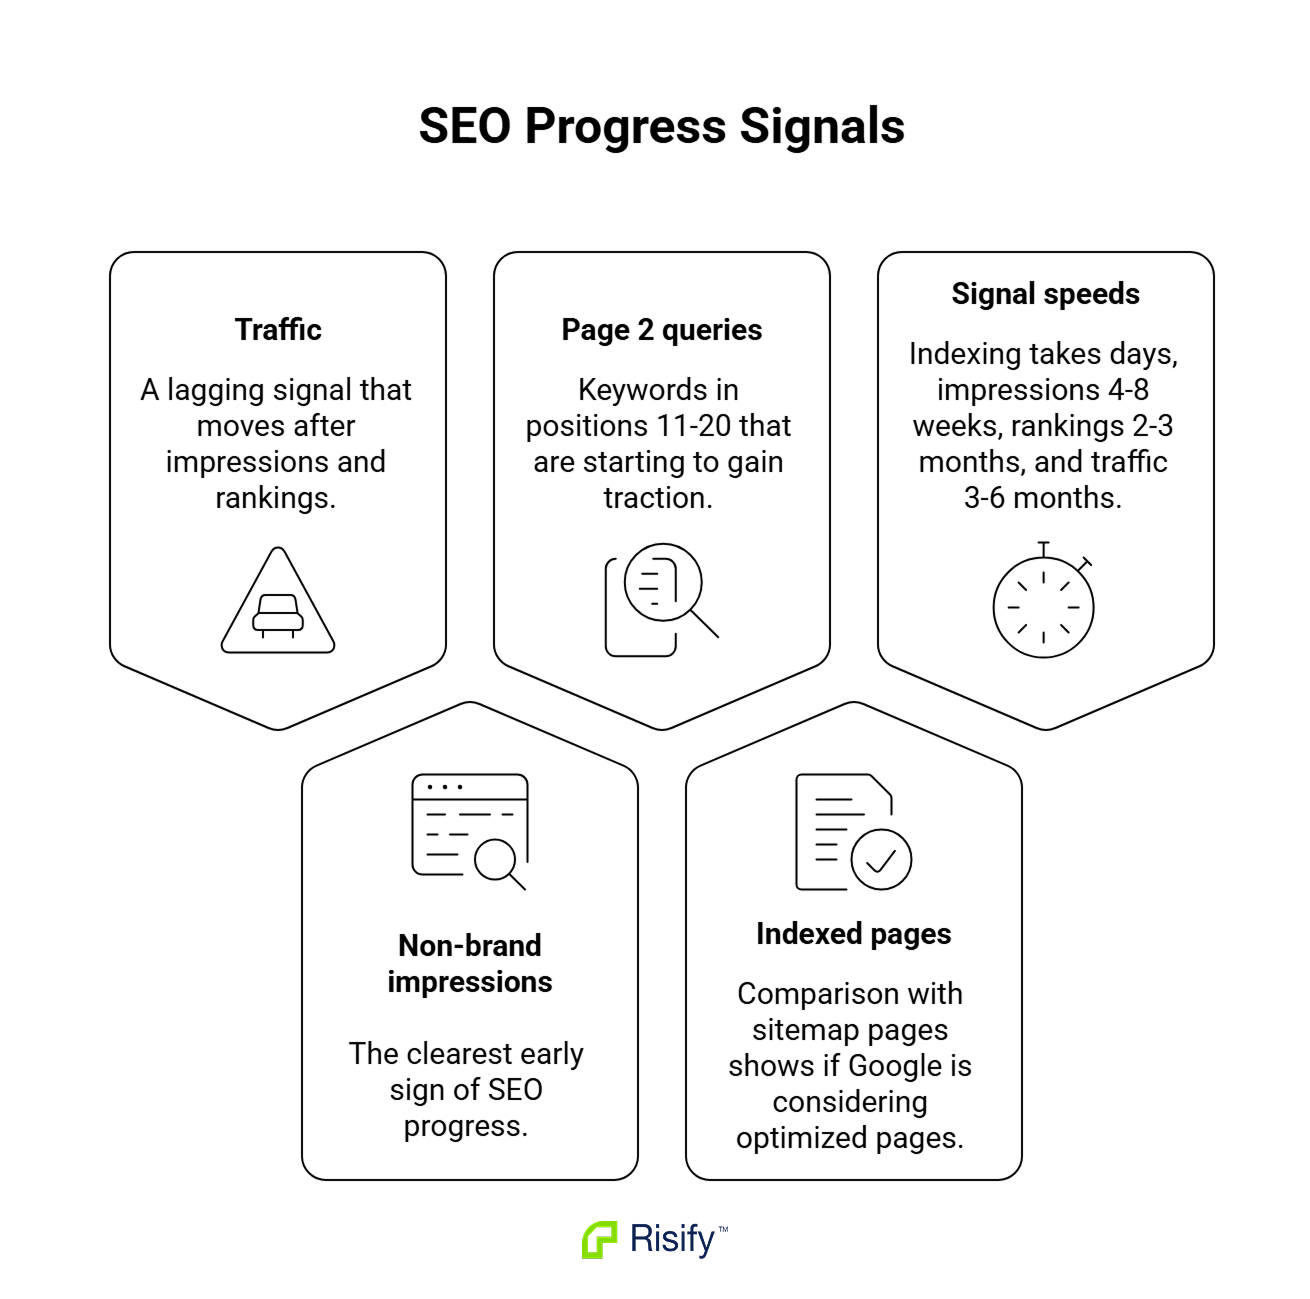
- Traffic is a lagging signal; impressions and rank position move weeks before sessions do.
- Non-brand impressions are the earliest honest signal, because branded impressions grow from social, paid, and PR without any SEO work happening.
- Queries sitting on page 2 (positions 11-20) are your leading indicator, since movement here is what SEO working looks like before traffic changes.
- Indexed page count against sitemap total tells you whether Google is even considering the pages you’re optimizing.
- Signals lag on different clocks: indexing in days, impressions in 4-8 weeks, position in 2-3 months, traffic in 3-6 months.
Why Traffic Alone Doesn’t Tell You If SEO Is Working
Organic traffic is the signal every merchant checks first, and it’s the signal that misleads them most often. Two things make it unreliable as a diagnostic.
Why does organic traffic lag SEO work by months?
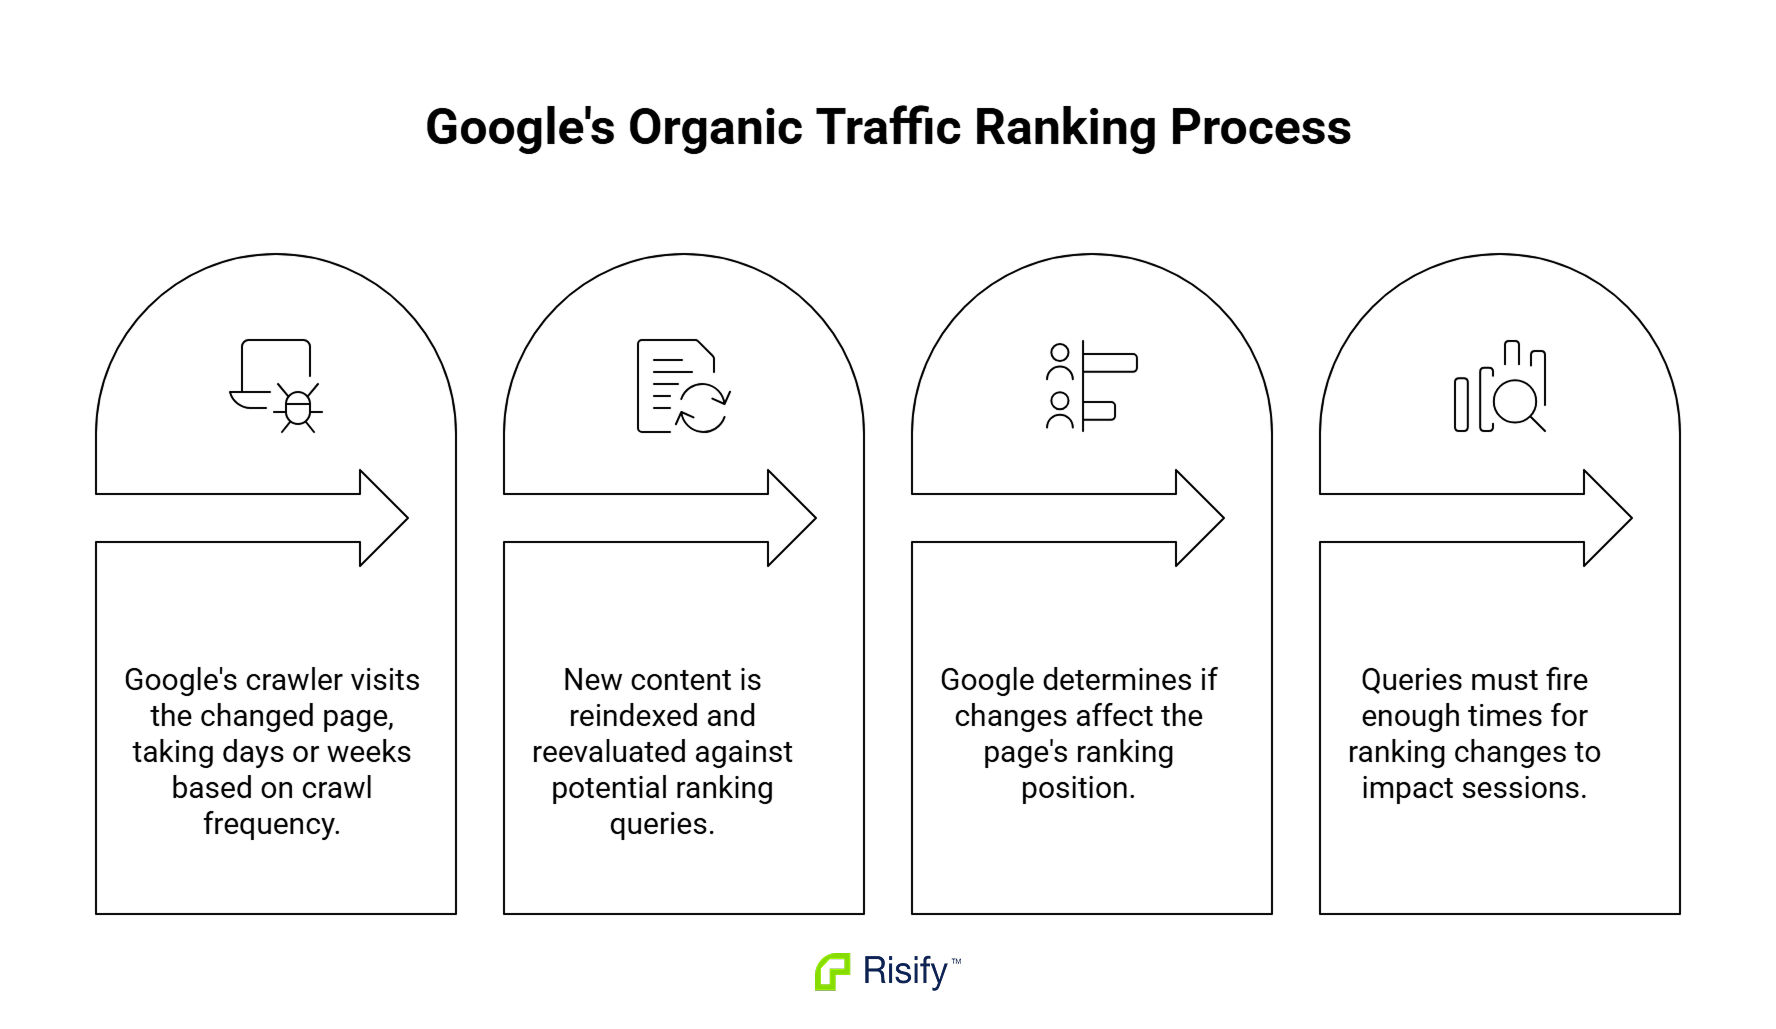
Google doesn’t rerank pages the moment you change them. It works through a slow chain of steps before the change shows up in your sessions:
- Recrawl: Google’s crawler has to visit the changed page, which can take days or weeks depending on how often it crawls your site.
- Reprocess: The new content gets reindexed and reevaluated against the queries it might rank for.
- Rerank: Google decides whether the changes affect where the page should rank.
- Query volume: The queries the page ranks for have to fire enough times for the ranking change to actually move sessions.
The full cycle usually runs three to six months on established pages, and six months or more on brand new pages, because Google needs time to build confidence in a page with no history. Looking at Google Analytics 60 days after shipping schema changes and concluding nothing worked means looking at data that hasn’t been generated yet.
Why does GA4’s organic channel mix real SEO wins with everything else?
GA4’s “organic search” channel counts every visit that came from a search engine and doesn’t separate two very different kinds of visits inside that number:
- Earned organic: Someone searched a category term (“leather bomber jackets”) and found you. That’s what grows when SEO works.
- Brand-driven organic: Someone searched your brand name directly. That number grows every time someone remembers to look you up: after a podcast mention, after seeing a paid ad, after getting a forwarded email. None of it is SEO.
The two get counted together, so a Google Ads campaign that drove branded search up 40% last month makes your organic sessions look great without any of the growth coming from actual SEO work.
The four signals below fix both problems. They move earlier than traffic, and they’re structured so brand growth can’t fake success.
For a broader review of the issues that can affect these signals, read our Shopify SEO audit guide
Signal 1 - Non-Brand Impressions in Search Console
Non-brand impressions count how often your pages appeared in Google results for queries that don’t contain your brand name. This is the single most reliable early signal that SEO is working, because it strips out everything that could make branded search grow for reasons that have nothing to do with organic search.
How do you check non-brand impressions?
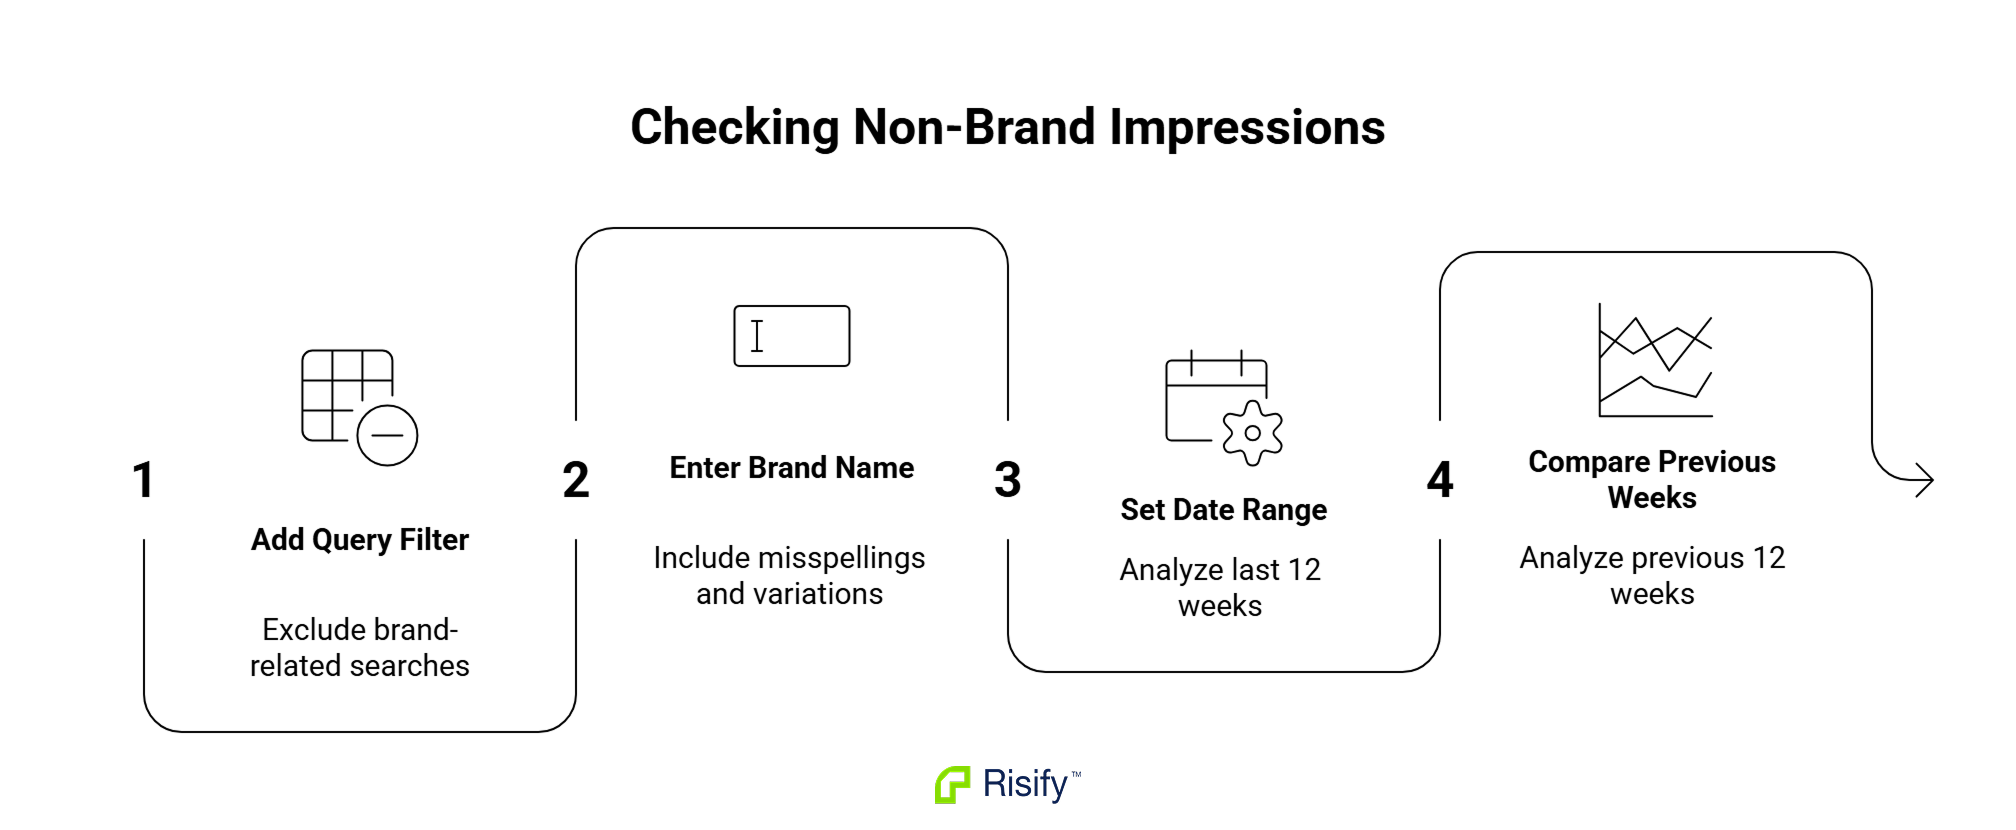
Open Search Console and go to the Performance report. From there:
- Add a Query filter and choose “doesn’t contain.”
- Enter your brand name, plus common misspellings and shortened versions people search for.
- Set the date range to the last 12 weeks.
- Compare against the previous 12 weeks.
What matters is the shape of the trend line, not any particular week. Weekly numbers are always jagged because search demand fluctuates and weekends look nothing like weekdays. The smoothed trend is the signal.
What does a healthy non-brand impression trend look like?
A gradual upward slope over eight to twelve weeks is what you’re hoping to see. Reading the trend correctly means knowing what different shapes mean:
- Steady climb over 2-3 months, no matching paid or social campaign: This is what SEO working looks like in the report.
- Flat with occasional spikes: Normal for a store that isn’t actively adding content or improving pages. Flat doesn’t mean broken.
- Sudden vertical spike, then decay: Almost always a one-off event (viral moment, algorithm test, seasonal peak). Not SEO progress.
The trend usually takes four to eight weeks to become readable after changed pages get reindexed. Anything shorter is noise.
The one false read to watch for is seasonality: If your impressions doubled in November and you sell holiday products, that’s the season, not your work. In seasonal categories, compare against the same period last year, not against the previous month.
Signal 2 - Queries Sitting Just Outside Page 1
Queries ranking between positions 11 and 20 are the leading indicator most Shopify merchants never think to look at. These are queries where your pages show up on page 2 of Google, and page 2 gets almost no clicks. In a traffic report they’re invisible: high impressions, near-zero clicks, no revenue. But movement in this bucket is what SEO actually working looks like, weeks before anything else moves.
A query that was at position 25 last month and is at position 14 this month has climbed 11 spots. It still has close to zero clicks, so nothing in your traffic report changed. But it’s one page from generating real sessions, and the trajectory is the signal. When queries in this range keep climbing and cross into positions 1-10, that’s when traffic moves. Watching the page 2 bucket lets you see the movement four to eight weeks before it hits sessions. The SEO term for this range is striking distance.
Why doesn’t average position tell you the same thing?
Search Console shows an average position metric for each page, and on its own it’s misleading.
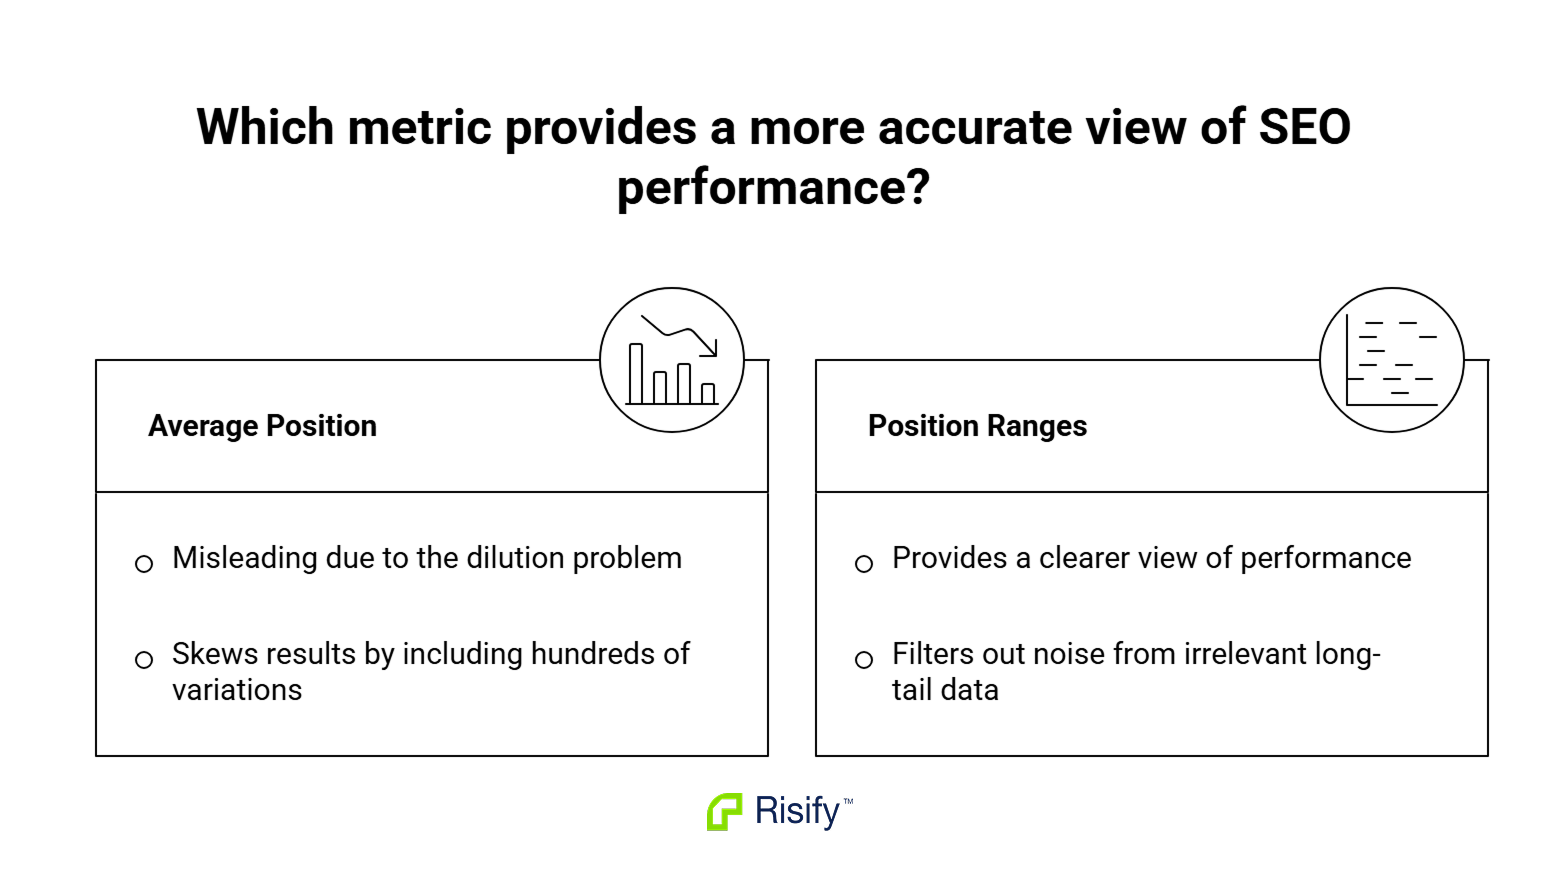
The dilution problem: A page that ranks at position 3 for its main query and position 90 for two hundred long-tail variations shows an average around 60. Real movement on the query that matters gets buried by the long tail.
The fix: Look at specific position ranges instead of averages. The 11-20 range is where the most useful movement happens.
How do you build the page 2 view manually in Search Console?
The manual workflow works. It just doesn’t save between sessions, which is why most people abandon it:
- Open the Performance report and go to the Queries tab.
- Add a Position filter with “is between” set to 11 and 20.
- Add a second Query filter for “doesn’t contain” plus your brand name to isolate non-branded.
- Sort by impressions descending.
- Export the list.
- Next month, repeat the whole process and compare against last month’s export.
What you’re looking at is your page 2 bucket, ranked by opportunity: high impressions here means the query has real demand and you’re one page from capturing it. The comparison over time is where the signal comes from, and rebuilding the filter and comparison each month is where the workflow breaks down.
Where Risify fits
Risify Keyword Tracking connects to your Search Console data and surfaces this view directly, without the monthly rebuild.
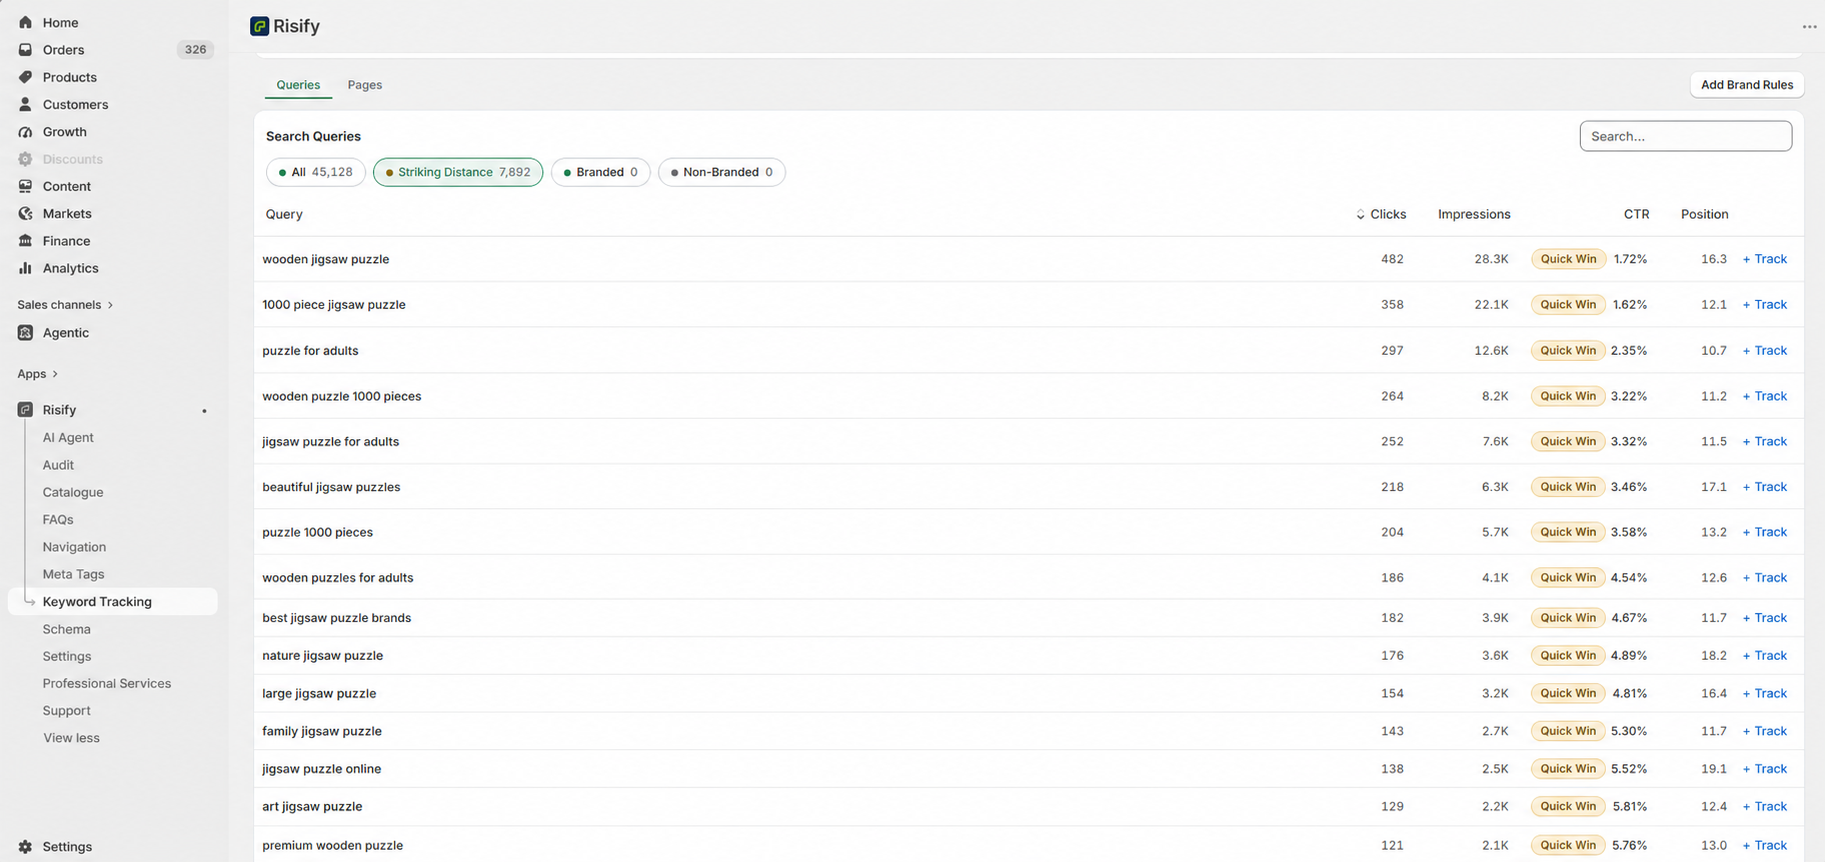
- Striking Distance tab: Groups queries ranking 11-20, splits them into branded and non-branded, and separates pages by type (collections, products, blogs, other).
- Quick Win flags: Applied to page 2 queries with enough search volume that a small optimization could push them onto page 1.
- Top 3 tab: Shows queries currently ranking in positions 1-3. When a query moves from striking distance last month to Top 3 this month, you can attribute the win to what you shipped in between.
For a step-by-step walkthrough, read How to Track Shopify Keyword Rankings in Risify
Position changes on established pages become visible in two to six weeks. On new pages, the first meaningful ranking usually takes three to six months, so a page that’s four weeks old at position 45 is a normal start, not a failure.
Signal 3 - Indexed Page Count vs Sitemap Total
The number of pages Google has actually indexed, compared to the total your sitemap lists, tells you whether Google is even considering the pages you’ve been optimizing. Every other signal here assumes your pages are in Google’s index. If they aren’t, it doesn’t matter how good the schema is or how well-written the title is, because the page isn’t eligible to rank at all.
How do you check indexed vs sitemap totals?
Two places to look, one on each side of the ratio:
- Google’s side: Search Console → Indexing → Pages report. You’ll see Indexed and Not indexed counts at the top.
- Your side: yourstore.com/sitemap.xml is the top-level file Shopify generates automatically. It links to sub-sitemaps by resource type (products, collections, pages, blogs). Add those totals for the sitemap number.
Compare the two.
What ratio should you expect to see?
Some gap is normal on any Shopify store. The sitemap includes out-of-stock products, unpublished collections in some setups, and low-value pages Google reasonably chooses not to index.
- 10-20% gap on a healthy catalog: Not a problem.
- 30%+ gap: Worth investigating, especially on products and primary collections.
- What matters more than the number: The reason for the gap, which the Not indexed report breaks down category by category.
The category worth paying the most attention to is “Discovered - currently not indexed.” Google knows the URL exists but decided not to crawl or index it. On Shopify, a large bucket here usually means Google considers those pages thin or too similar to other pages you already have.
Which Shopify-specific patterns hurt indexing the most?
A handful of Shopify behaviors show up over and over in the Not indexed report:
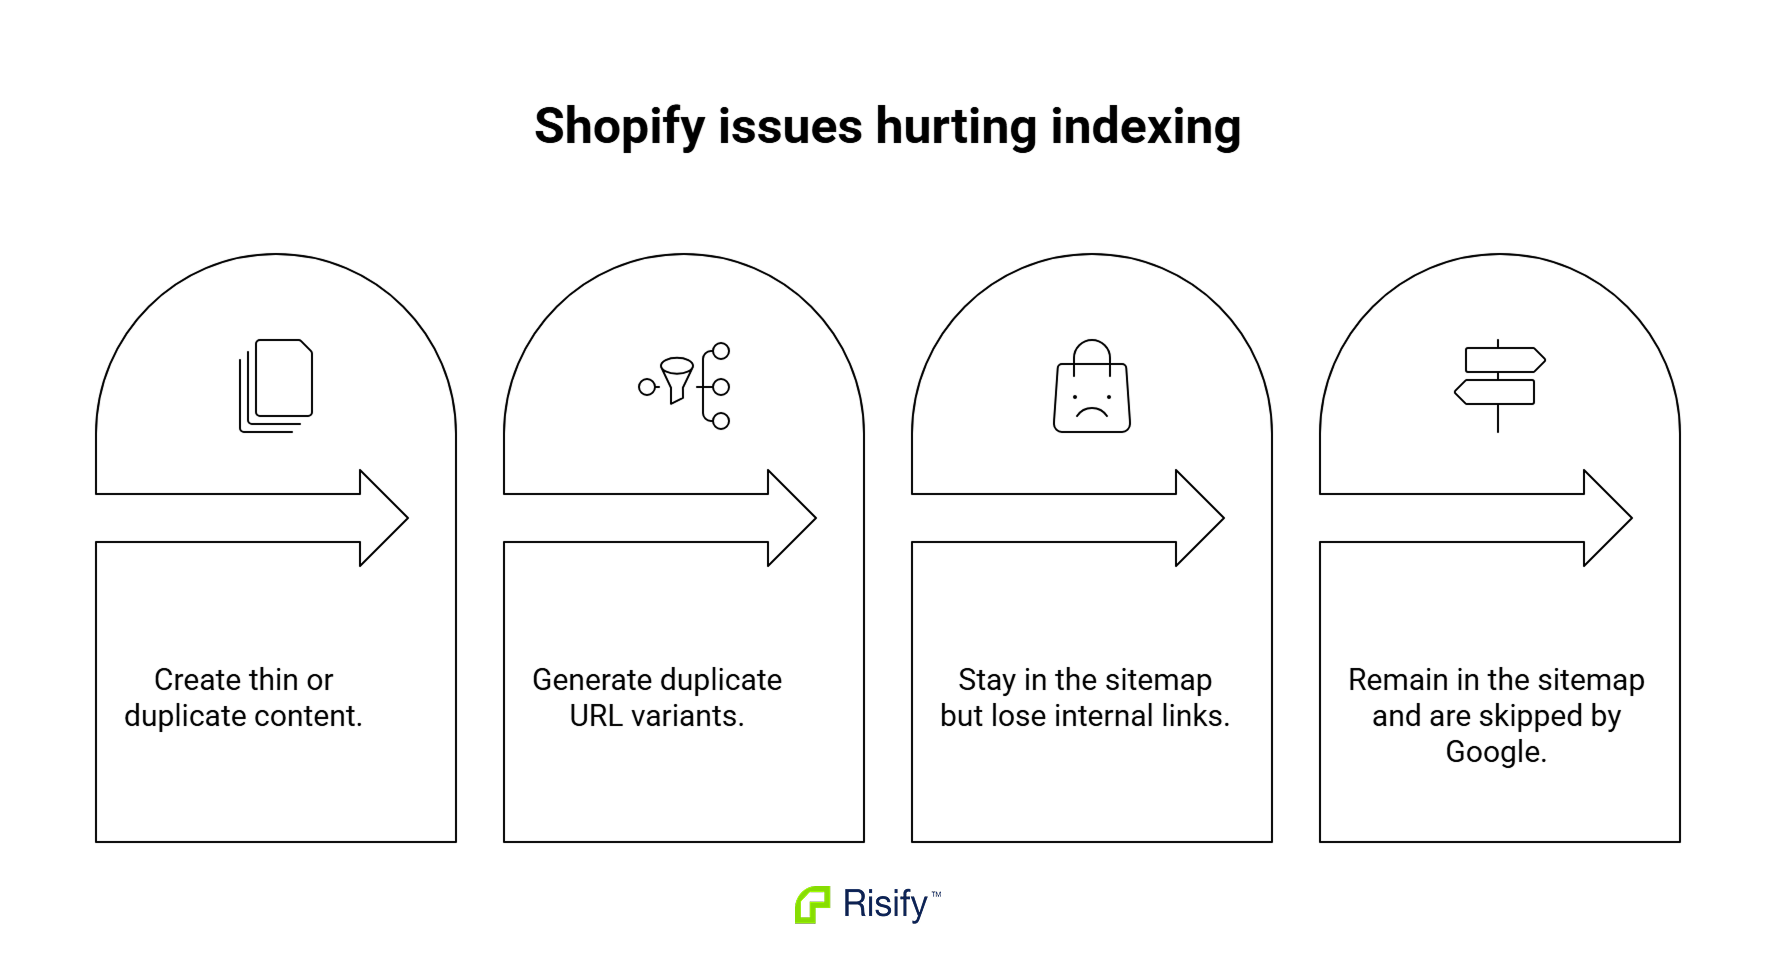
- Tag pages: Auto-generated URLs from product tags. They often duplicate collection content and get filtered out as thin or duplicate.
- Filter and sort URL variants: URLs with parameters like ?sort_by=price-ascending create versions Google may treat as duplicates. Canonical tags fix this, but not every theme sets them correctly.
- Sold-out products the theme hides: If your theme hides sold-out products from category pages but the sitemap still lists their URLs, Google finds those URLs, sees they’re hidden or thin, and drops them.
- Redirected old URLs still in the sitemap: After a URL change, Shopify sometimes keeps the old URL in the sitemap longer than expected. Google marks them redirected and skips them.
Indexing changes are the fastest signal here, usually visible within one to fourteen days. Fix a canonical issue or remove low-quality URLs from the sitemap and expect the count to reflect it within two weeks.
Related reading: How to Improve Your Shopify Store Structure and Navigation
Signal 4 - Click-Through Rate on Category Pages
Click-through rate on category pages tells you whether your titles and meta descriptions are working, separately from whether your rankings are working. The two are different problems with different fixes, and the reason merchants often confuse them is that they show up together in the same report. Learning to read them apart saves a lot of wasted work.
Why do category pages matter more here than product pages?
The SERPs look different for each, and that changes what CTR is telling you.
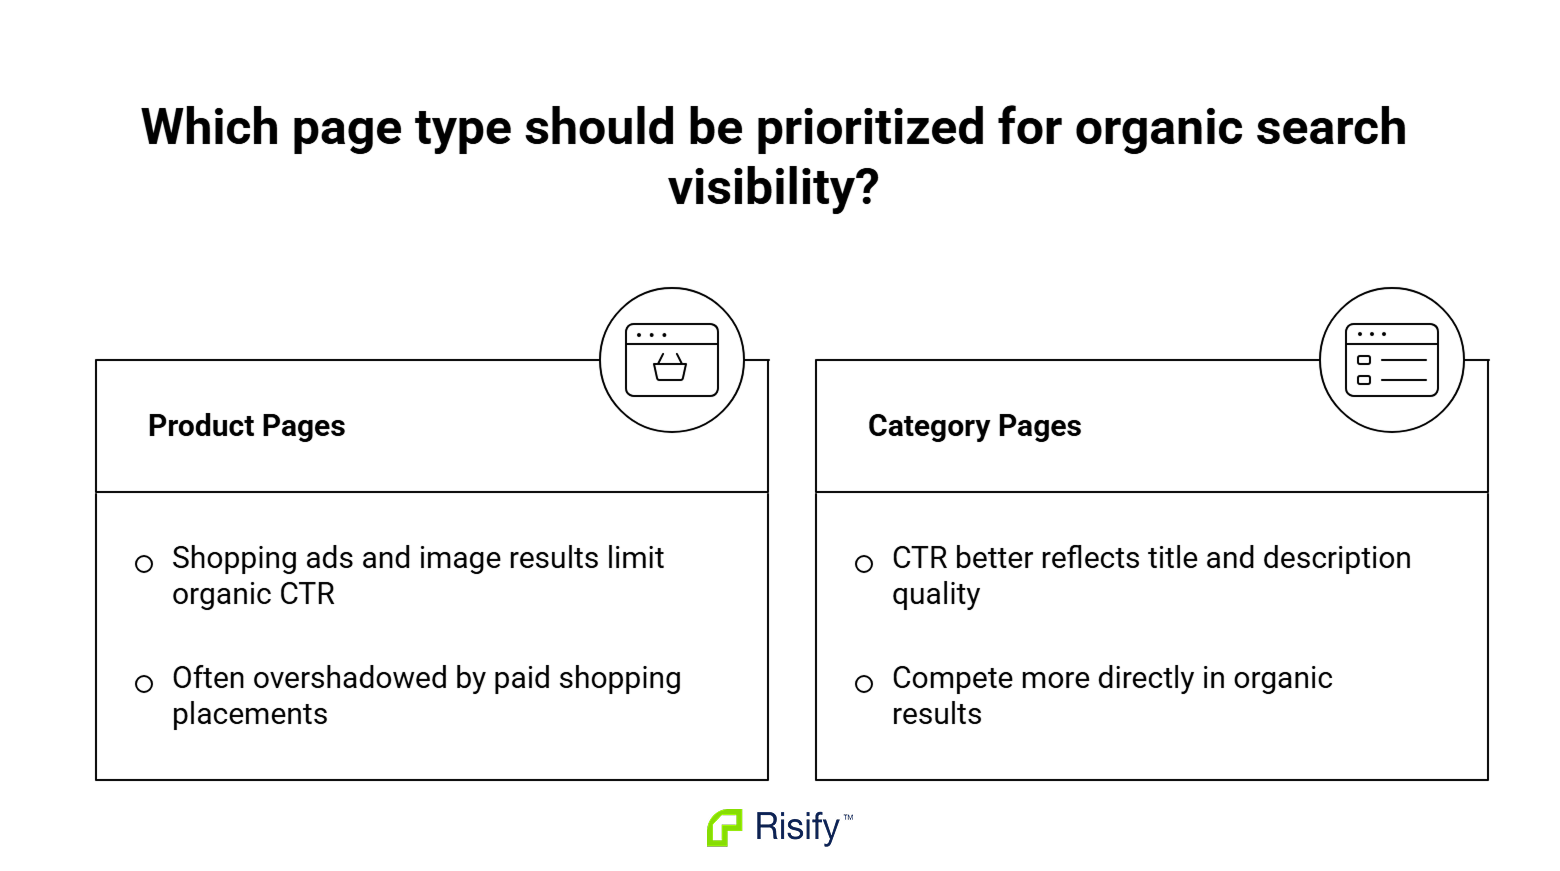
Product page SERPs: Dominated by Shopping ads, image packs, and Google’s Shopping tab. That layout caps how much organic CTR any product page can capture, no matter how well-written the title is. A product page at position 4 sitting under six Shopping ads has low CTR because of the layout, not the snippet.
Category page SERPs: Category pages compete on regular organic snippets. CTR there is a genuine signal of whether your title and description are doing their job.
A category page at position 5 with 1% CTR is telling you something worth acting on. A product page at the same position with the same CTR is mostly telling you about the SERP layout.
How do you diagnose category page CTR against position?
The workflow is straightforward once you have the benchmark:
- Go to the Performance report and open the Pages tab.
- Filter for URLs containing /collections/.
- Sort by impressions.
- Look at position and CTR side by side.
- Compare against a position-adjusted benchmark. At position 5, a category page should generally see 4-6% CTR based on Advanced Web Ranking’s public CTR study.
A category page at position 5 with 1% CTR is underperforming by roughly four or five times, and that gap is the diagnostic. Two patterns come out of this reading:
Low CTR at a good position: The ranking works, the snippet is the problem. Title reads generic or the description doesn’t match search intent. A rewrite fixes it. For more on titles and descriptions, read What Meta Tags Do for Shopify Stores
High CTR at a mediocre position: Snippet works, ranking doesn’t. People click even at a low position, which means intent match is right and the missing piece is authority or content depth. Rewriting the title won’t help; better internal linking, deeper content, and stronger on-page signals will.
For practical ways to strengthen these pages, read Building Better Shopify Collection Pages
Where Risify fits
Cross-referencing position against CTR across every category page in Search Console means filtering, sorting, exporting, building a benchmark table, and comparing row by row. Risify Keyword Tracking’s Pages view does the work automatically:
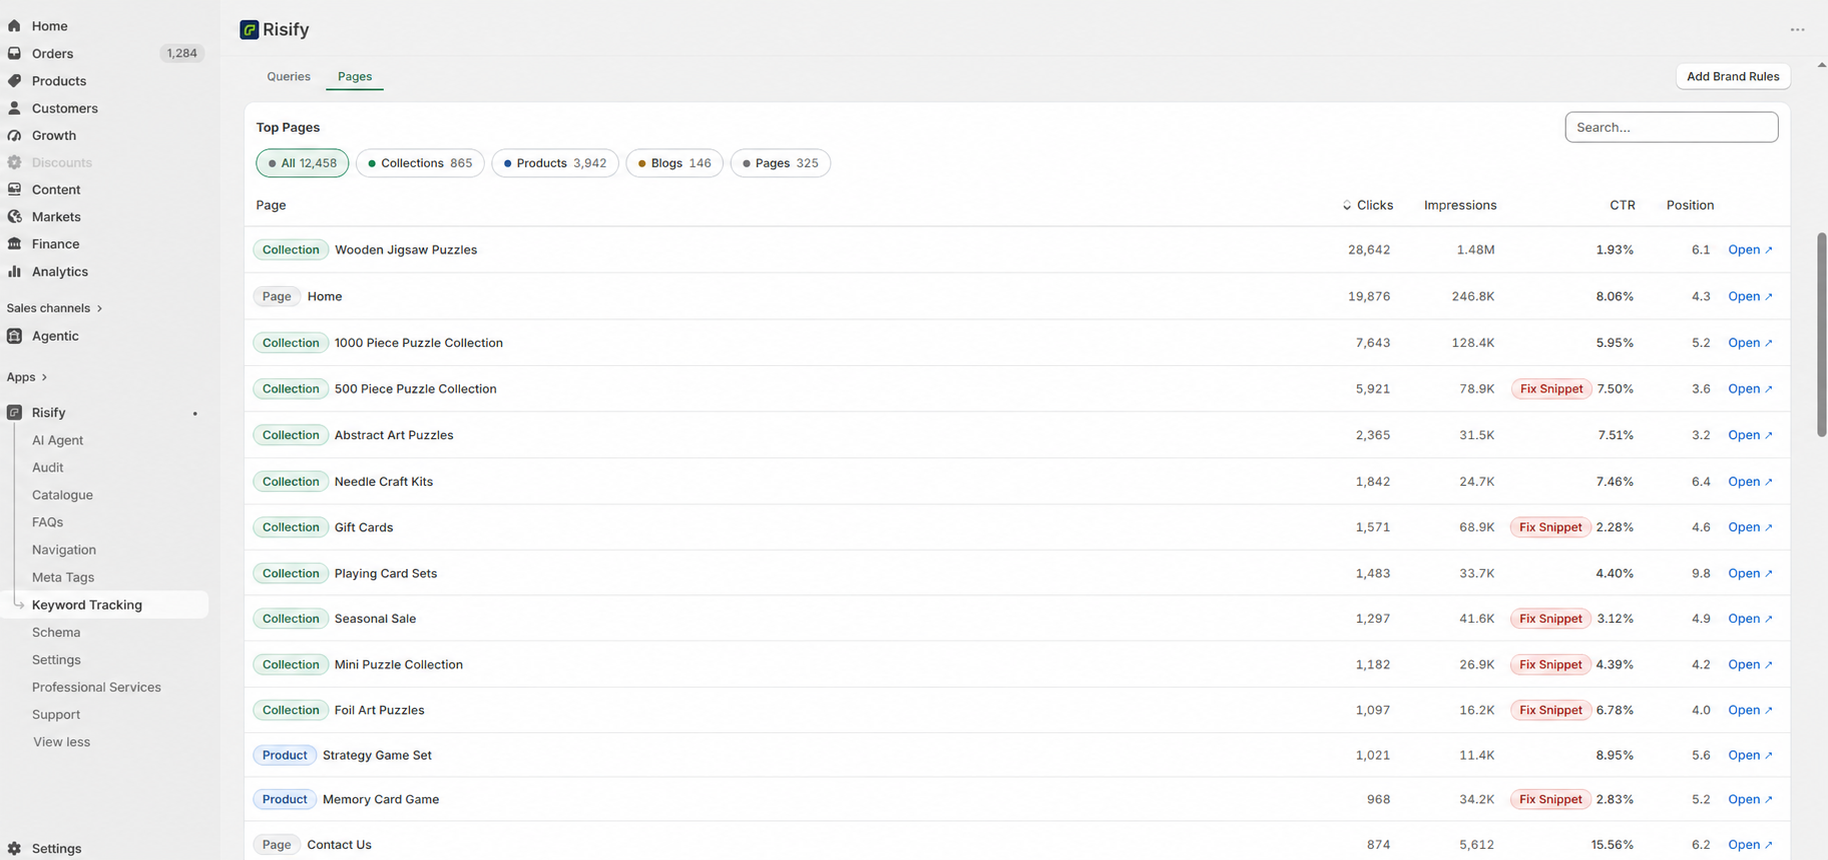
Splits pages by type: Collections, products, blogs, and other pages are separated, so you can look at each type on its own terms.
Fix Snippet flag: Applied to pages where the CTR is below what would be expected given the current position. Instead of building the comparison yourself, you see the underperforming category pages listed with the flag.
False Signals That Look Like SEO Success
A few patterns look like SEO wins in the reports and aren’t. Learning to spot them saves you from crediting your work for things it didn’t do.
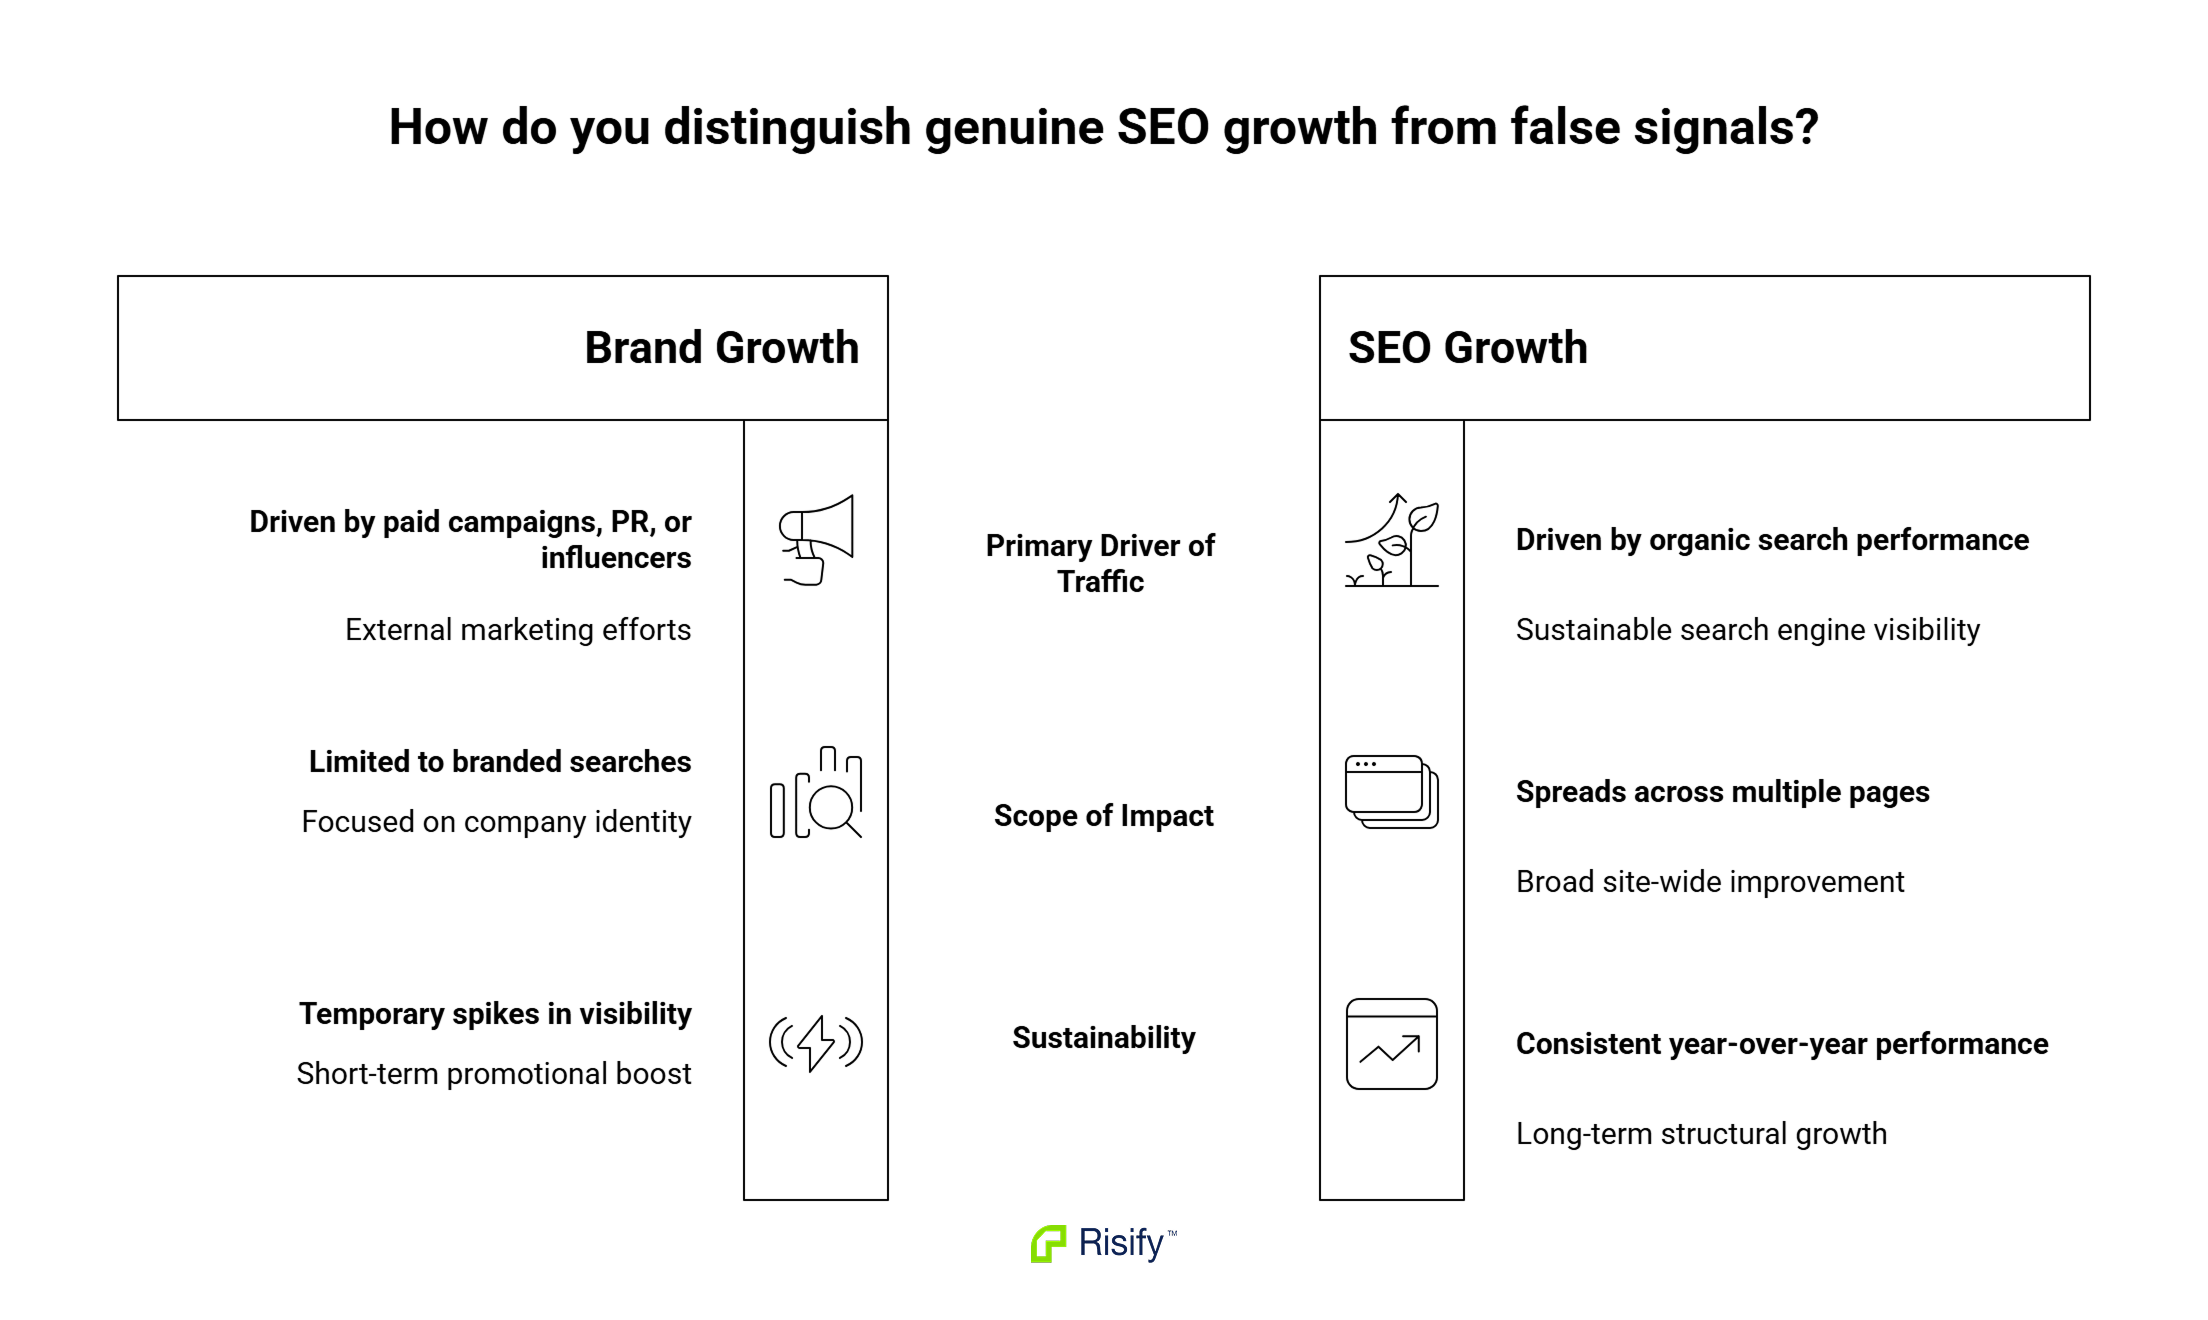
Brand search growth from things that aren’t SEO: A podcast mention, influencer post, or paid campaign drives branded search up. Impressions and sessions spike. Without filtering brand from non-brand, you’ll credit SEO for something it didn’t do. The check: did non-brand impressions move at the same time? If not, it’s brand growth.
Viral or seasonal product traffic: One product goes viral on TikTok or hits a seasonal peak, and traffic to that page jumps. Real traffic, not SEO, and it won’t repeat next month. The check: is the traffic on one URL or spread across the catalog? SEO wins lift many pages by small amounts; viral wins concentrate on one.
Direct traffic misattributed as organic: Deep links, dark social, and app referrals sometimes show up in GA4 as organic when they aren’t. The check: cross-reference GA4 organic against GSC clicks for the same period. They should match within 10-20%. If GA4 organic is three times GSC clicks, some of that “organic” isn’t organic.
Seasonal comparison drift: Comparing this month against last month in a seasonal category (holiday gifts, back-to-school, tax season) will show large swings that have nothing to do with SEO. In seasonal categories, always compare against the same period last year.
What Lags What - The Time Horizon You Should Actually Expect
Each signal has its own clock. Watching them on the wrong timeline is why merchants abandon work that was actually on track:
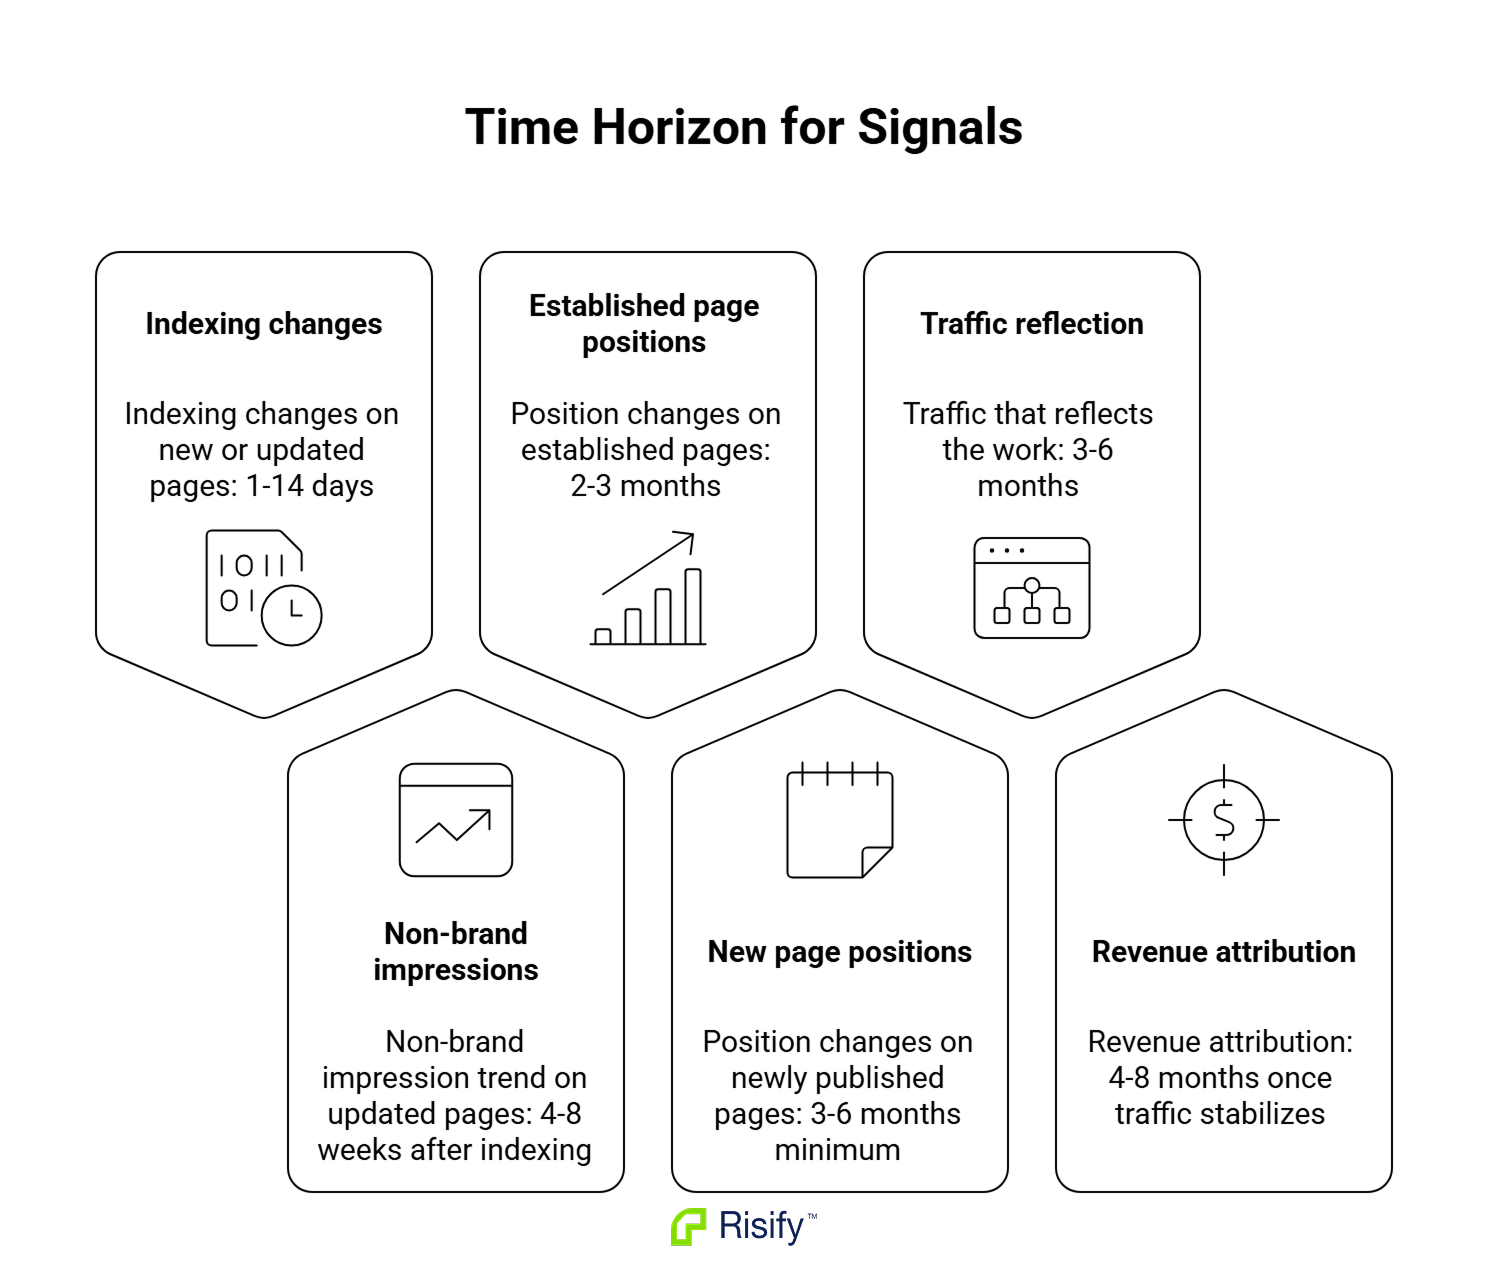
- Indexing changes on new or updated pages: 1-14 days
- Non-brand impression trend on updated pages: 4-8 weeks after indexing
- Position changes on established pages: 2-3 months
- Position changes on newly published pages: 3-6 months minimum
- Traffic that reflects the work: 3-6 months
- Revenue attribution: 4-8 months once traffic stabilizes
At the two-month mark, nothing should have moved in traffic yet. The right question at that point is whether impressions and page 2 rankings are climbing. If those are moving, you’re on track and traffic will follow.
A Monthly Shopify SEO Review That Takes 30 Minutes
Weekly and daily rank checking is noise. Search demand fluctuates, algorithm updates hit and roll back, and rankings vary by location and personalization. At short intervals you see movement that isn’t there and miss trends that are. Monthly is the right cadence, and thirty minutes is enough if you know what to look at:
- Non-brand impression trend, 12-week rolling window: Up, flat, or down against the previous 12 weeks?
- Queries entering and leaving positions 11-20: New entries are opportunities. Queries that graduated to positions 1-10 are wins to attribute. Queries that fell to page 3 or worse are regressions to investigate.
- Indexed page count delta: Up (good if you added pages), flat (fine on a stable catalog), or down (investigate, especially if you didn’t remove anything).
- Category page CTR by position bucket: Group into positions 1-3, 4-10, and 11+, compare CTR against benchmarks, and flag pages underperforming their position.
- New pages published this month and whether they’ve been indexed: A new collection not indexed 30 days after publishing is blocked and needs manual submission through Search Console.
- One-line note on what shipped this month: Schema, new pages, restructured collections, updated titles. Next month’s review references this to attribute movement.
If schema is one of the changes you’re tracking, read Shopify Schema Markup Explained
Save each report. Month-over-month comparison is what makes diagnosis possible.
Frequently Asked Questions
How long before I should expect to see Shopify SEO results?
Impressions move in 4-8 weeks after indexing. Positions on established pages move in 2-3 months, on new pages 3-6 months minimum. Traffic follows position by 4-8 weeks, so the honest expectation is 3-6 months for traffic to reflect SEO work on established pages, and 6+ months for new content. Faster timelines usually mean the work was narrower (fixing a broken canonical, un-noindexing a page) or the promise is inflated.
Is Google Search Console enough, or do I need a keyword tracking tool?
GSC covers signals 1 and 3 (impressions and indexing) and has the raw data for signal 4 (CTR). For signal 2 (page 2 queries over time), the data is there but you have to filter, split, and export monthly to see trends. A tool that reads GSC data saves the setup and keeps historical comparison automatically. GSC alone is workable if you’re willing to maintain a spreadsheet.
What’s a healthy indexing rate for a Shopify store?
No single number, because Shopify sitemaps include pages Google reasonably chooses not to index. Rough guide: for products and primary collections, above 85-90% indexed is healthy. Below 70% suggests structural problems (duplicate content, canonical issues, thin pages). Low indexing on tag pages and filtered category variants is normal.
Can I trust GSC’s average position metric on its own?
Not really. It averages across every query a page ranks for, so a page at position 3 for its main query and position 90 for 200 long-tail queries shows an average around 60. That tells you nothing about the query you care about. Watch specific queries or position ranges (like 11-20) instead.
Why don’t my GA4 organic sessions match GSC clicks?
They count differently. GSC counts every click on your listing, GA4 counts sessions after the click loads and analytics fires. Ad blockers, slow page loads, and immediate bounces make GA4 undercount. A 10-20% gap is normal. A 3x gap in either direction means something is misconfigured.
What’s a striking distance keyword?
Striking distance is the SEO term for a query where you rank between positions 11 and 20, meaning you’re on page 2 of Google. These queries have almost no clicks, so they don’t appear in traffic reports, but they’re the earliest signal that SEO is working. When they climb into positions 1-10, that’s when traffic moves.
Should I check rankings daily?
No. Results vary by location and personalization, and Google runs constant small tests. Daily numbers are noise. Weekly at earliest for spot-checks, monthly for account-level review. Exception: after a big theme migration or algorithm update, watch daily for a week to catch anything catastrophic, then return to monthly.